Instacart Grocery Basket
Customer Segmentation with Python
Motivation
Instacart possesses a wealth of customer data, offering insights into their purchasing habits. Recognizing the limitations of a generic marketing approach, they are exploring the idea of targeted marketing. Their goal is to tailor marketing campaigns to specific customer groups to measure the impact on product sales.
Objective
The goal of this analysis is to conduct exploratory data analysis on Instacart’s customer and sales data to uncover insights and suggest segmentation strategies that address critical stakeholder inquiries. These insights will guide targeted marketing initiatives and product strategies to improve customer engagement and drive sales optimization.
Key Questions
- What are the busiest days and hours?
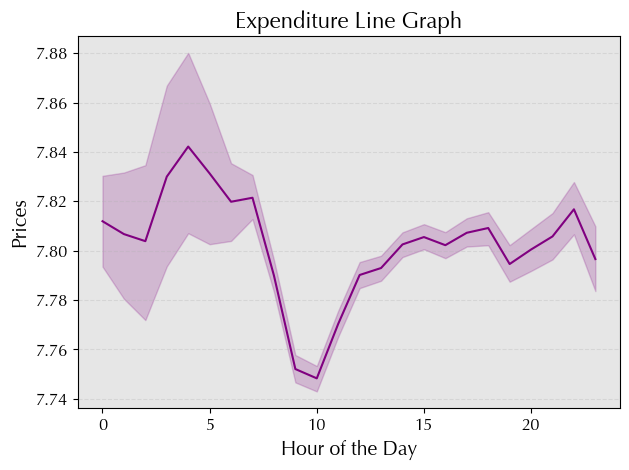
- When do people spend the most money during the day?
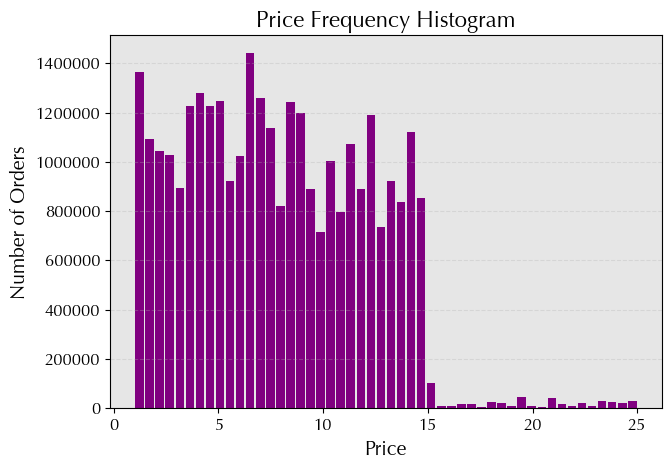
- How can price tags be simplified?
- Which departments have the highest order frequency?
- What are the different types of customers in the system; how do their ordering behaviors vary?
Project Scale
3 Weeks | 10 Deliverables
Tools
Python | Jupyter Notebooks | Excel
Population Flow
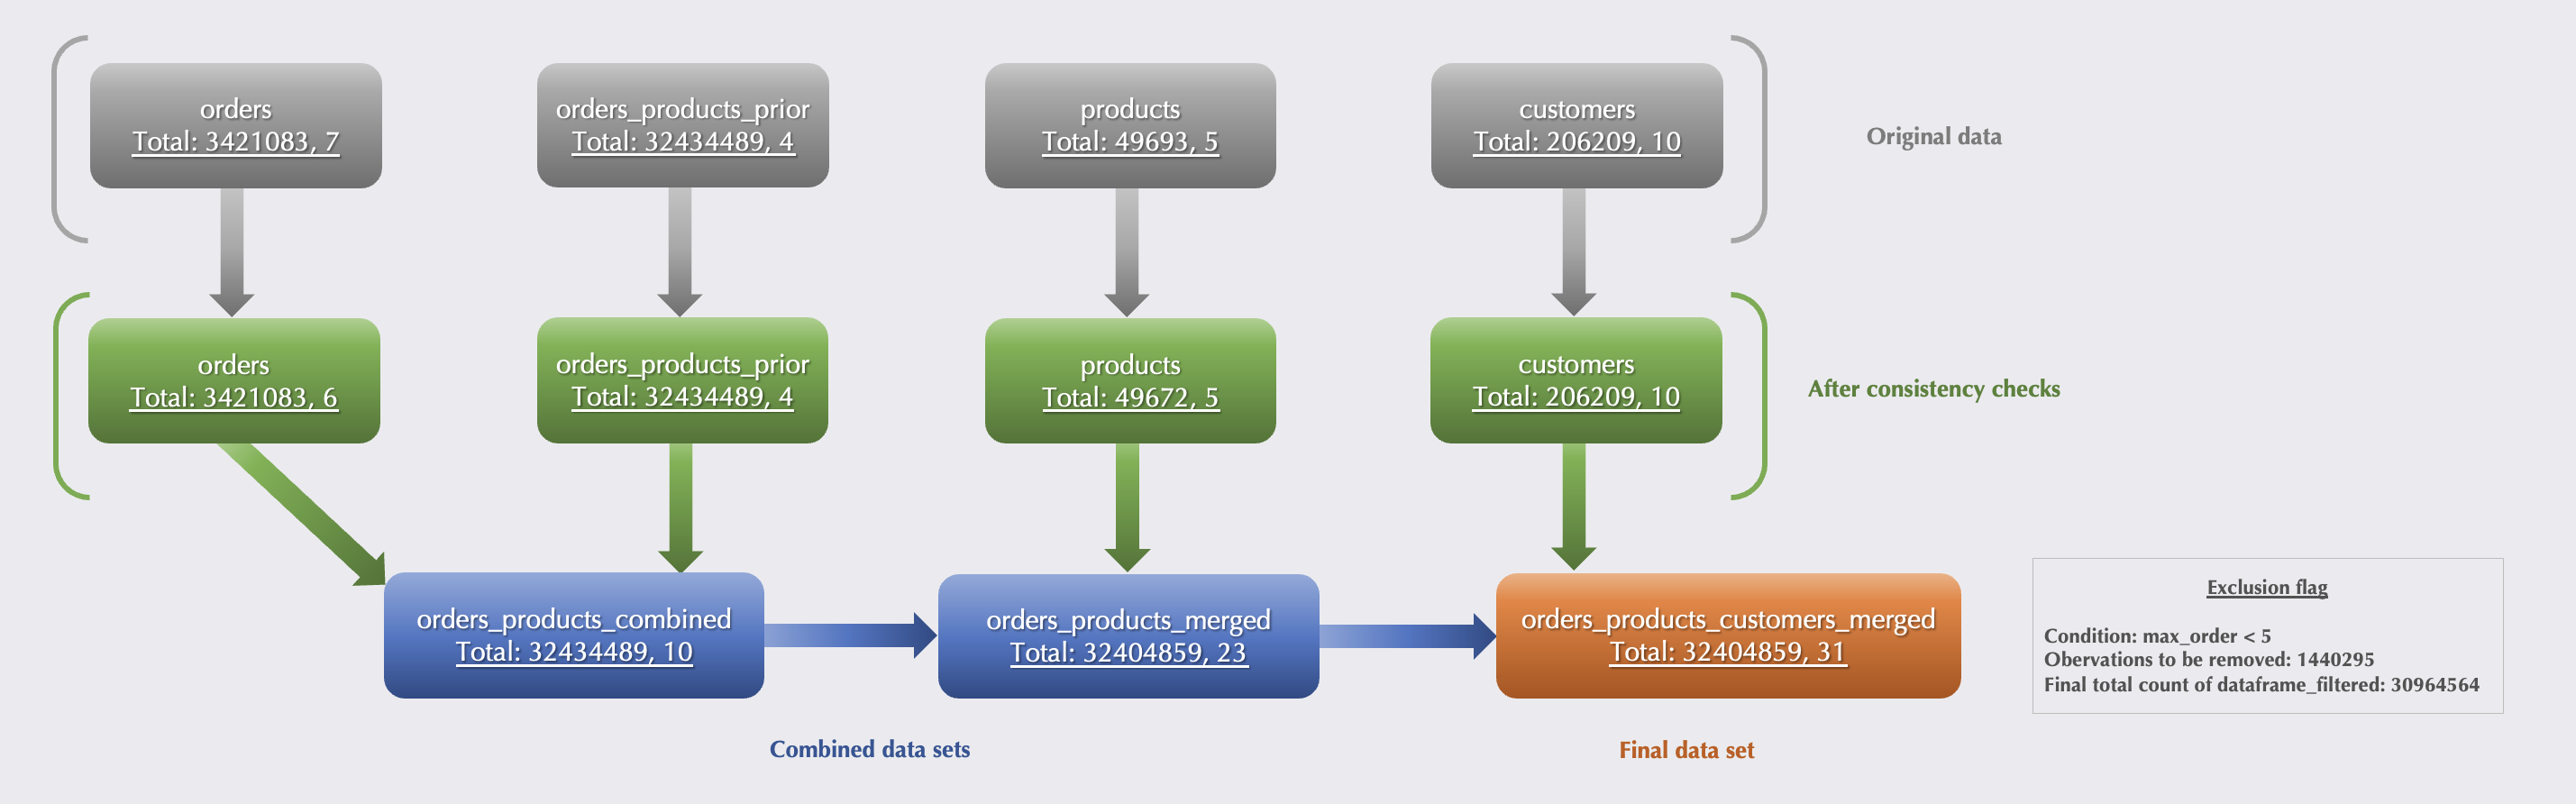
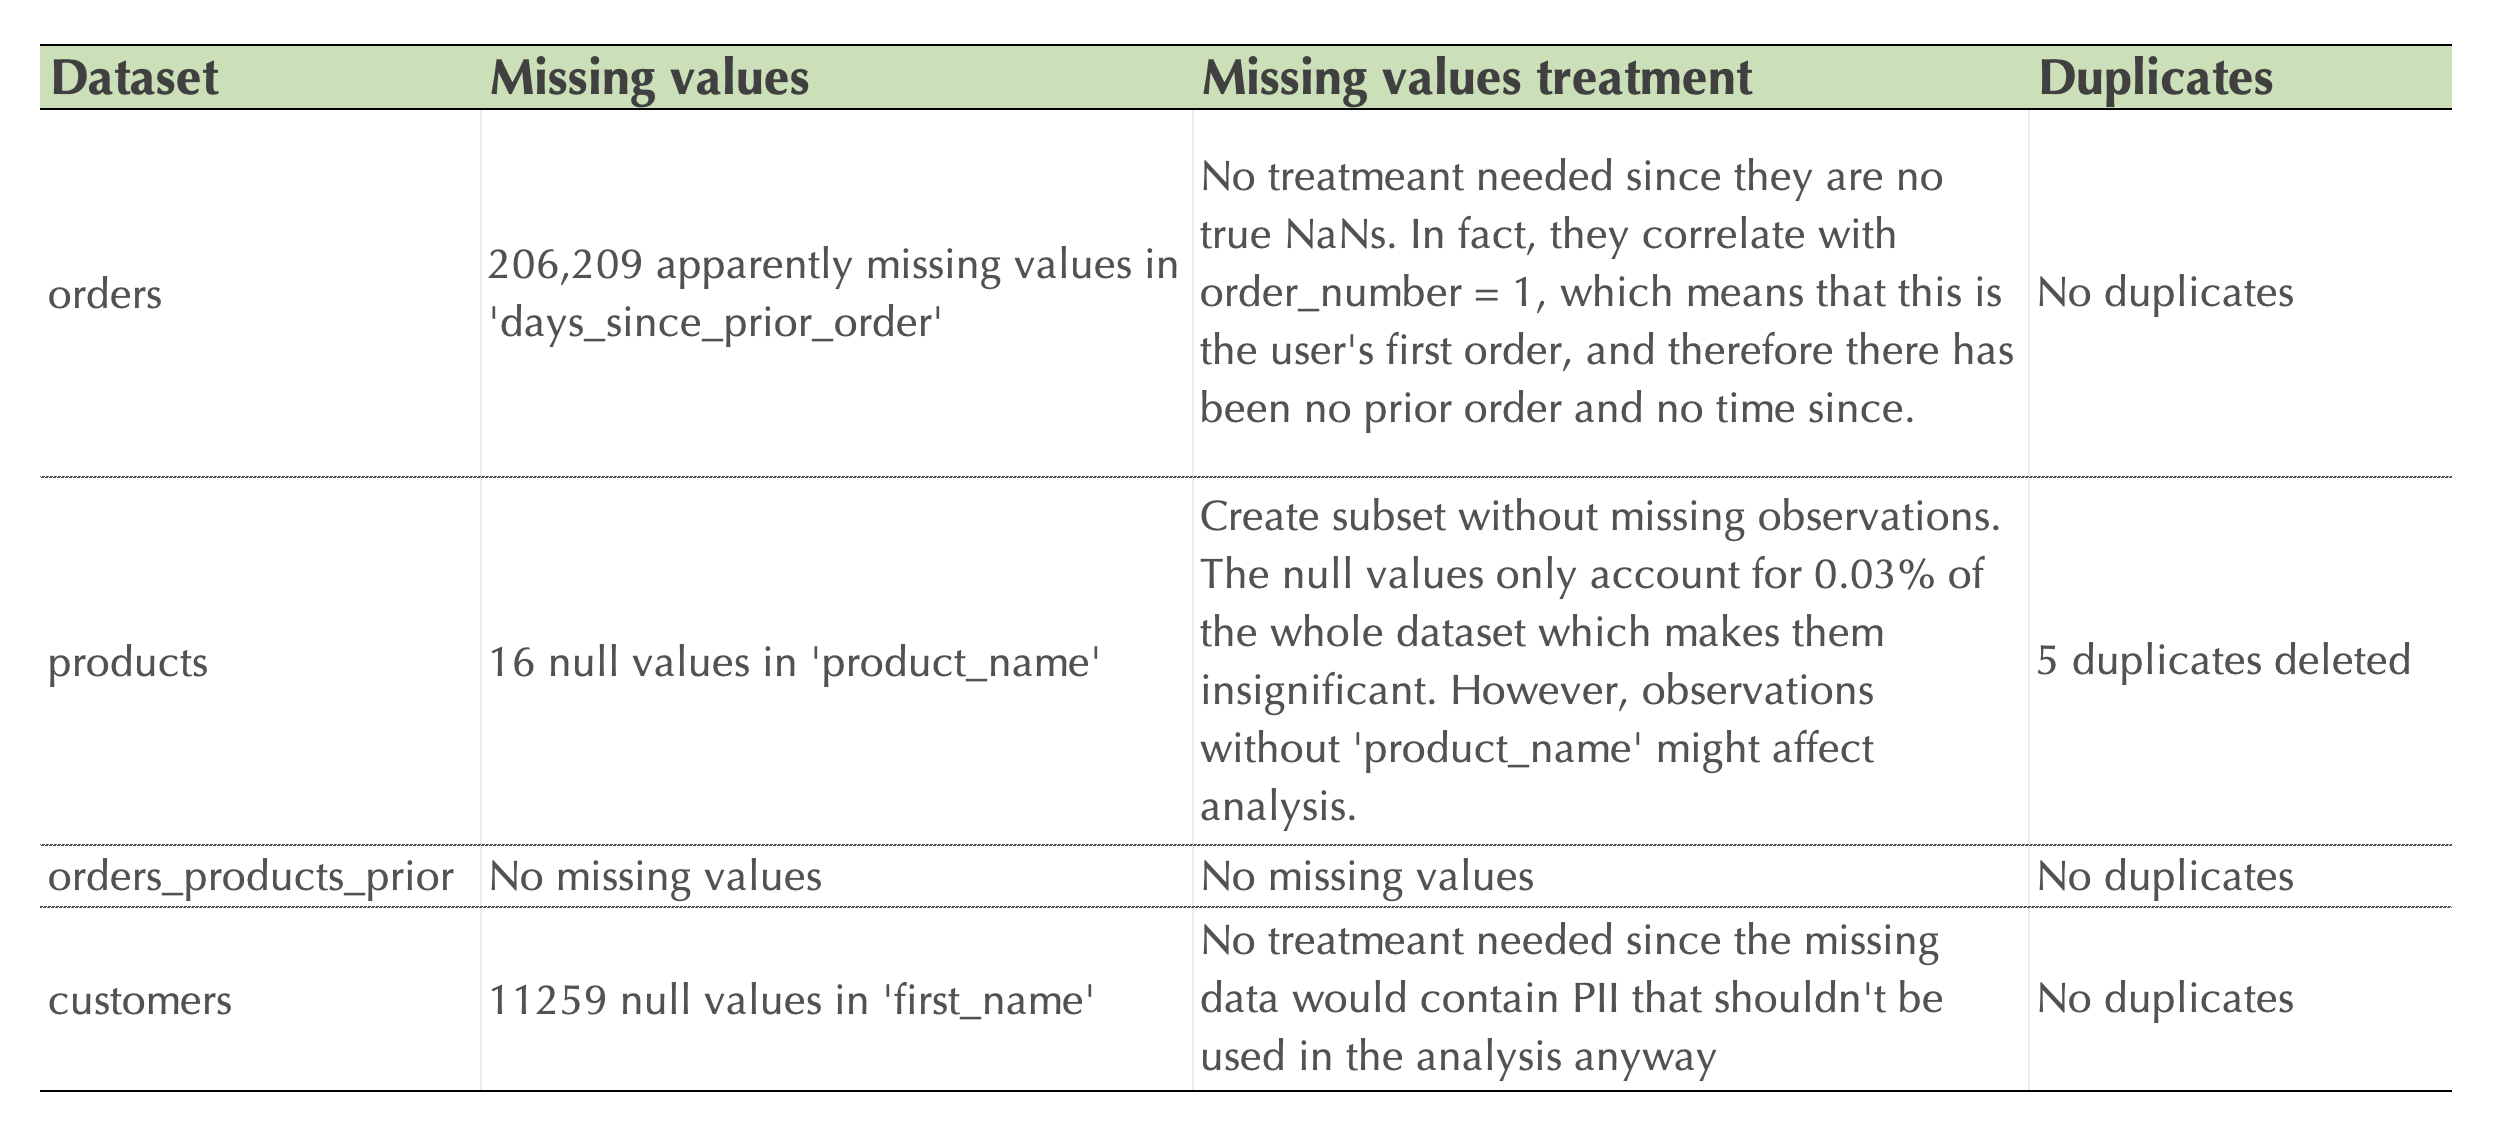
Data Consistency Checks
Objective: Ensure data integrity by resolving inconsistencies, missing values, and duplicates.
Process:
- Fixed mixed type variables: Columns with mixed data types have been standardized to a single type.
- Missing values: Missing values have been identified and handled appropriately, either by imputing values or removing rows/columns as needed.
- Duplicate removal: Duplicate records were detected and removed to avoid skewing analysis results.
Outcome: A consistent and accurate dataset, free from anomalies.
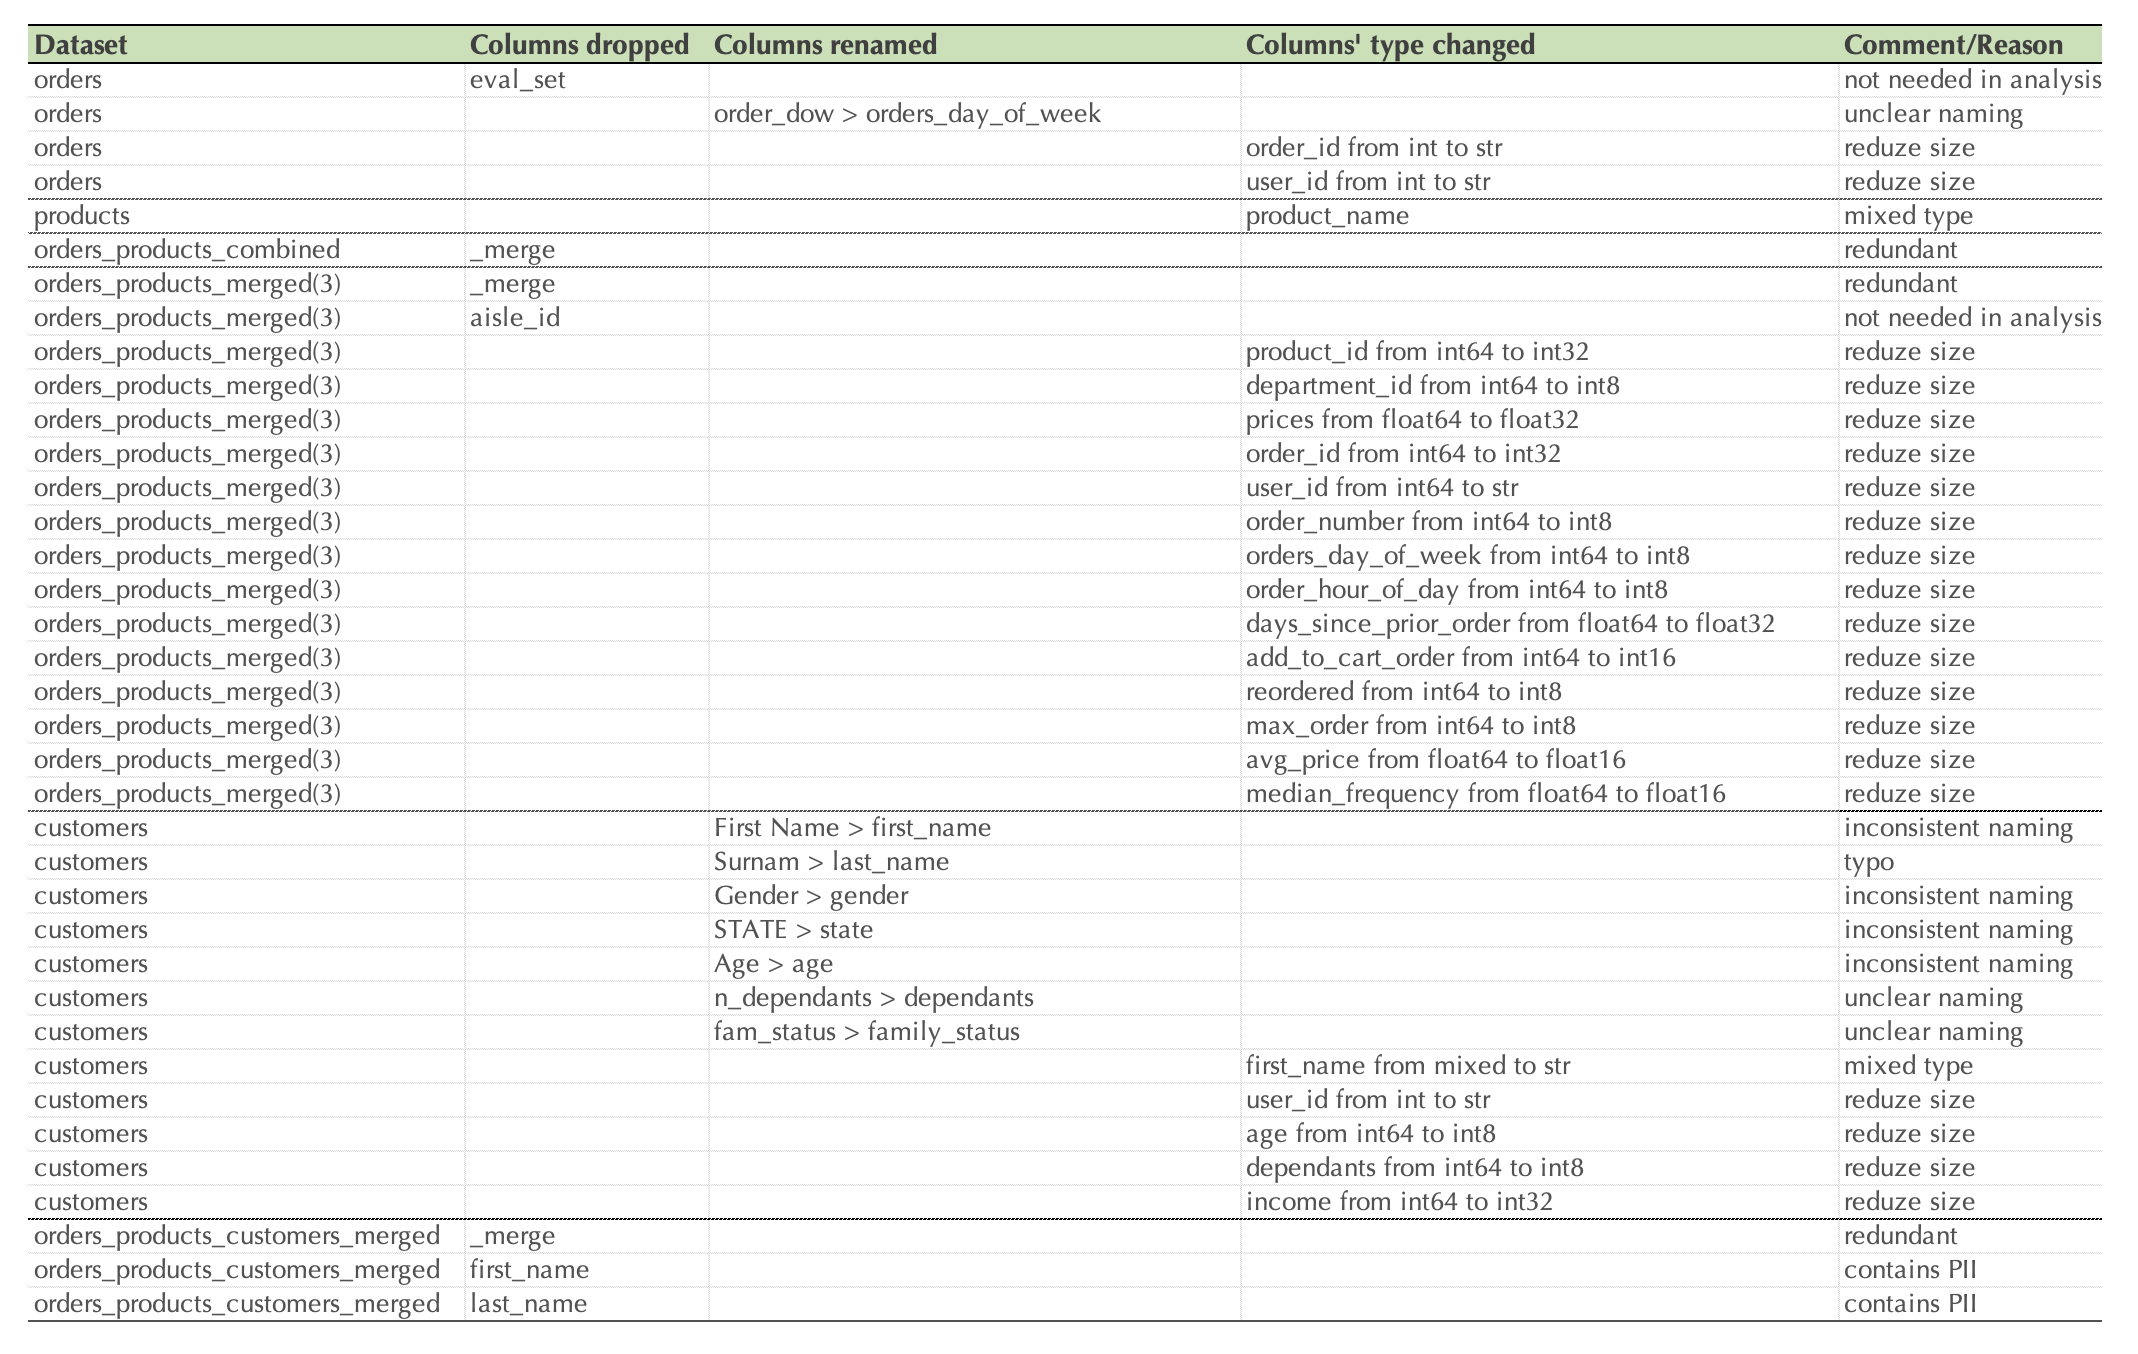
Data Wrangling & Subsetting
Objective: Clean and subset data to facilitate meaningful analysis.
Process:
- Data type adjustment and renaming: Identifier variables have been converted to appropriate data types, such as converting numeric IDs to strings for consistency. Columns have been renamed for clarity based on the data dictionary.
- Value interpretation: A data dictionary was used to determine the meaning of various values to ensure accurate interpretation.
- Dataframe creation: New dataframes were created based on specific criteria, such as orders placed in a particular month or by specific customer segments.
- User activity analysis: Examined variable frequencies to answer questions about user activity, such as most frequently ordered items or peak order times.
Outcome: Cleaned and well-organized data ready for further analysis.
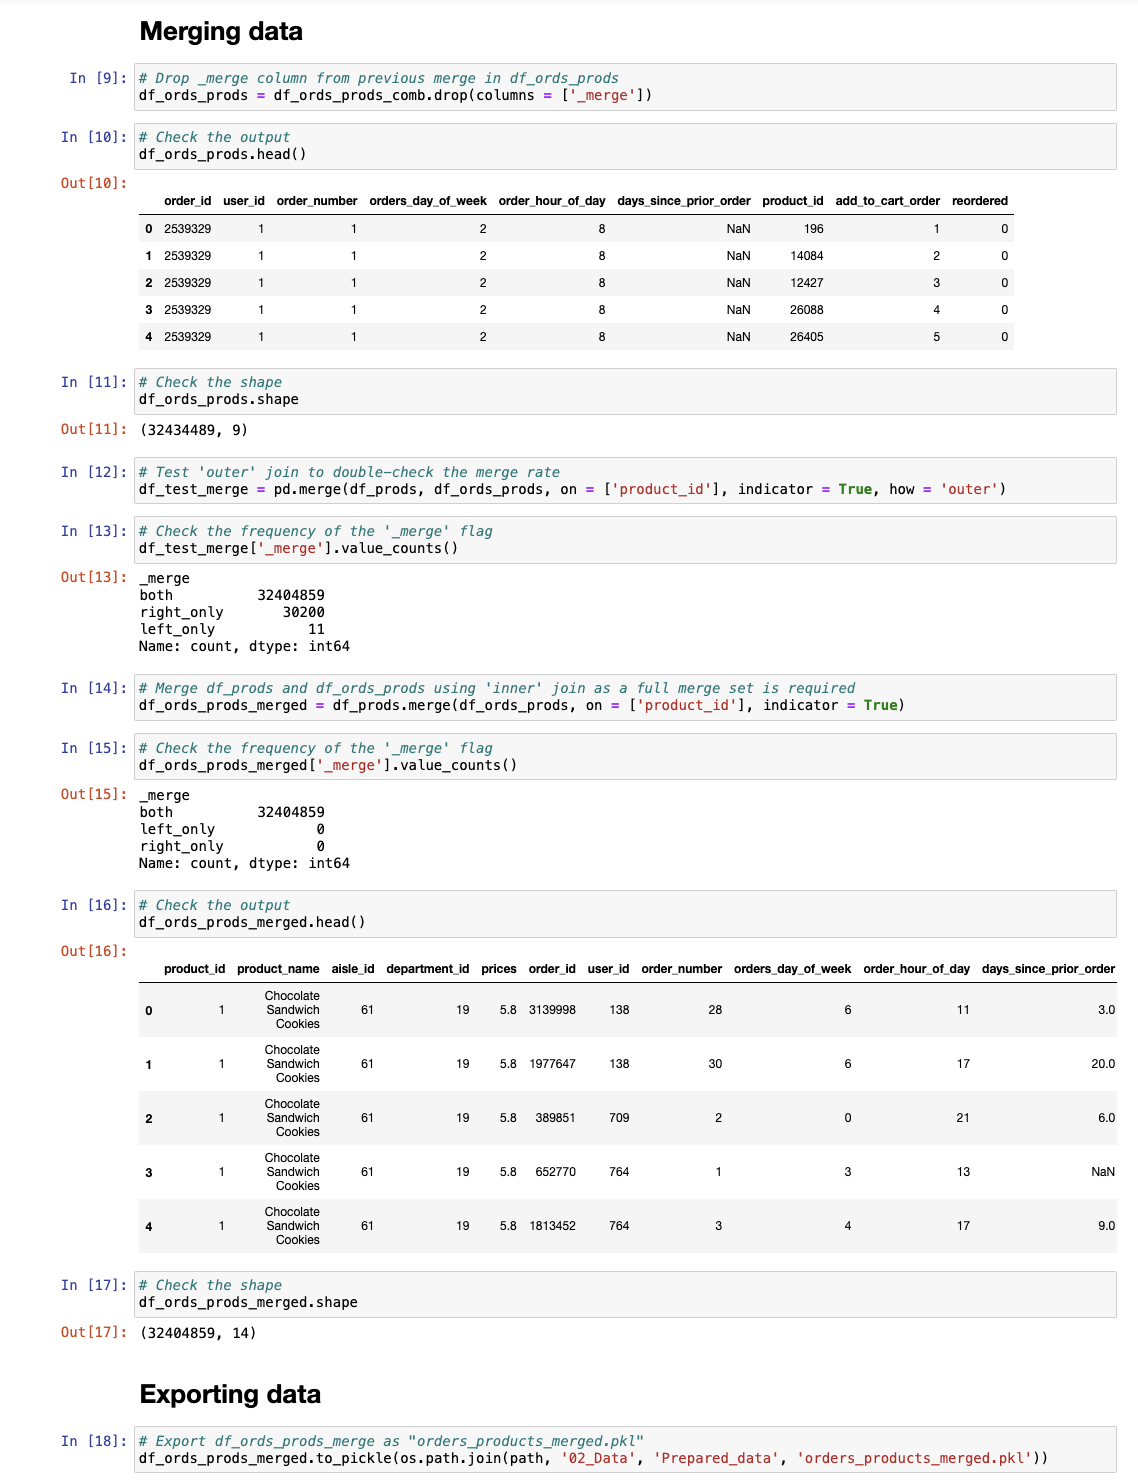
Combining & Exporting Data
Objective: Merge multiple dataframes and prepare the data for further analysis.
Process:
- Merging dataframes: Different data frames were merged using common keys. Merge flag frequencies were analyzed to ensure successful joins and to identify any mismatches.
- Data export: The merged dataset was exported as a pickle file for efficient storage and retrieval.
Outcome: A comprehensive dataset ready for analysis, stored in an easily accessible format.
Deriving New Variables
Objective: Create new variables to enhance data analysis.
Process:
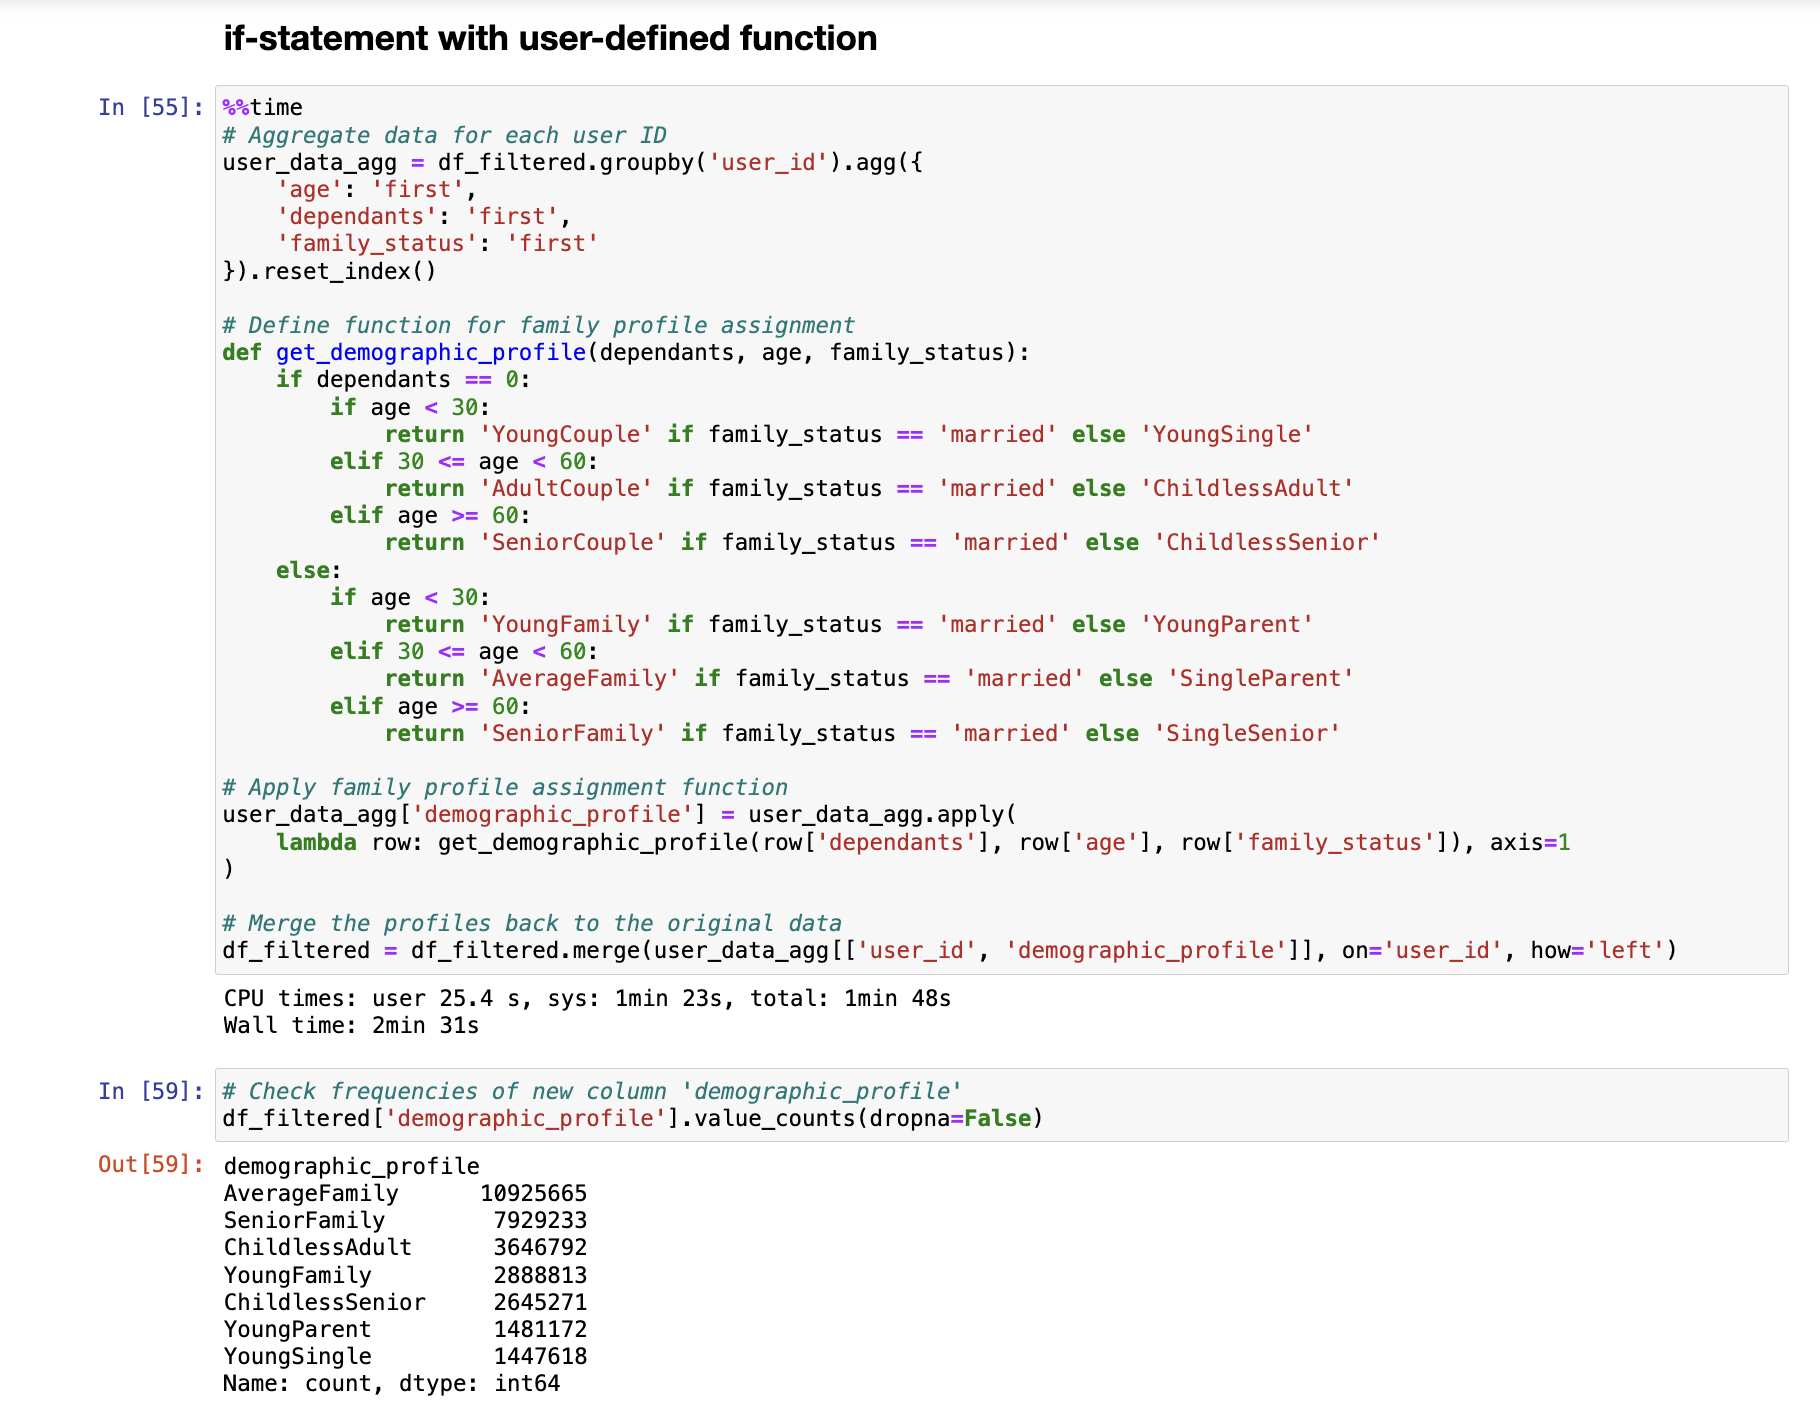
- Conditional logic: New columns have been created using if-statements, custom functions, the loc() function, and for-loops. For example, apart from the ones shown below, a column that shows high-value customers based on their total spend.
- User activity insights: These new variables provided deeper insight into customer behavior and preferences.
Outcome: Expanded dataset with new insightful variables.


Grouping & Aggregating Data
Objective: Aggregate data and create new flags for detailed analysis.
Process:
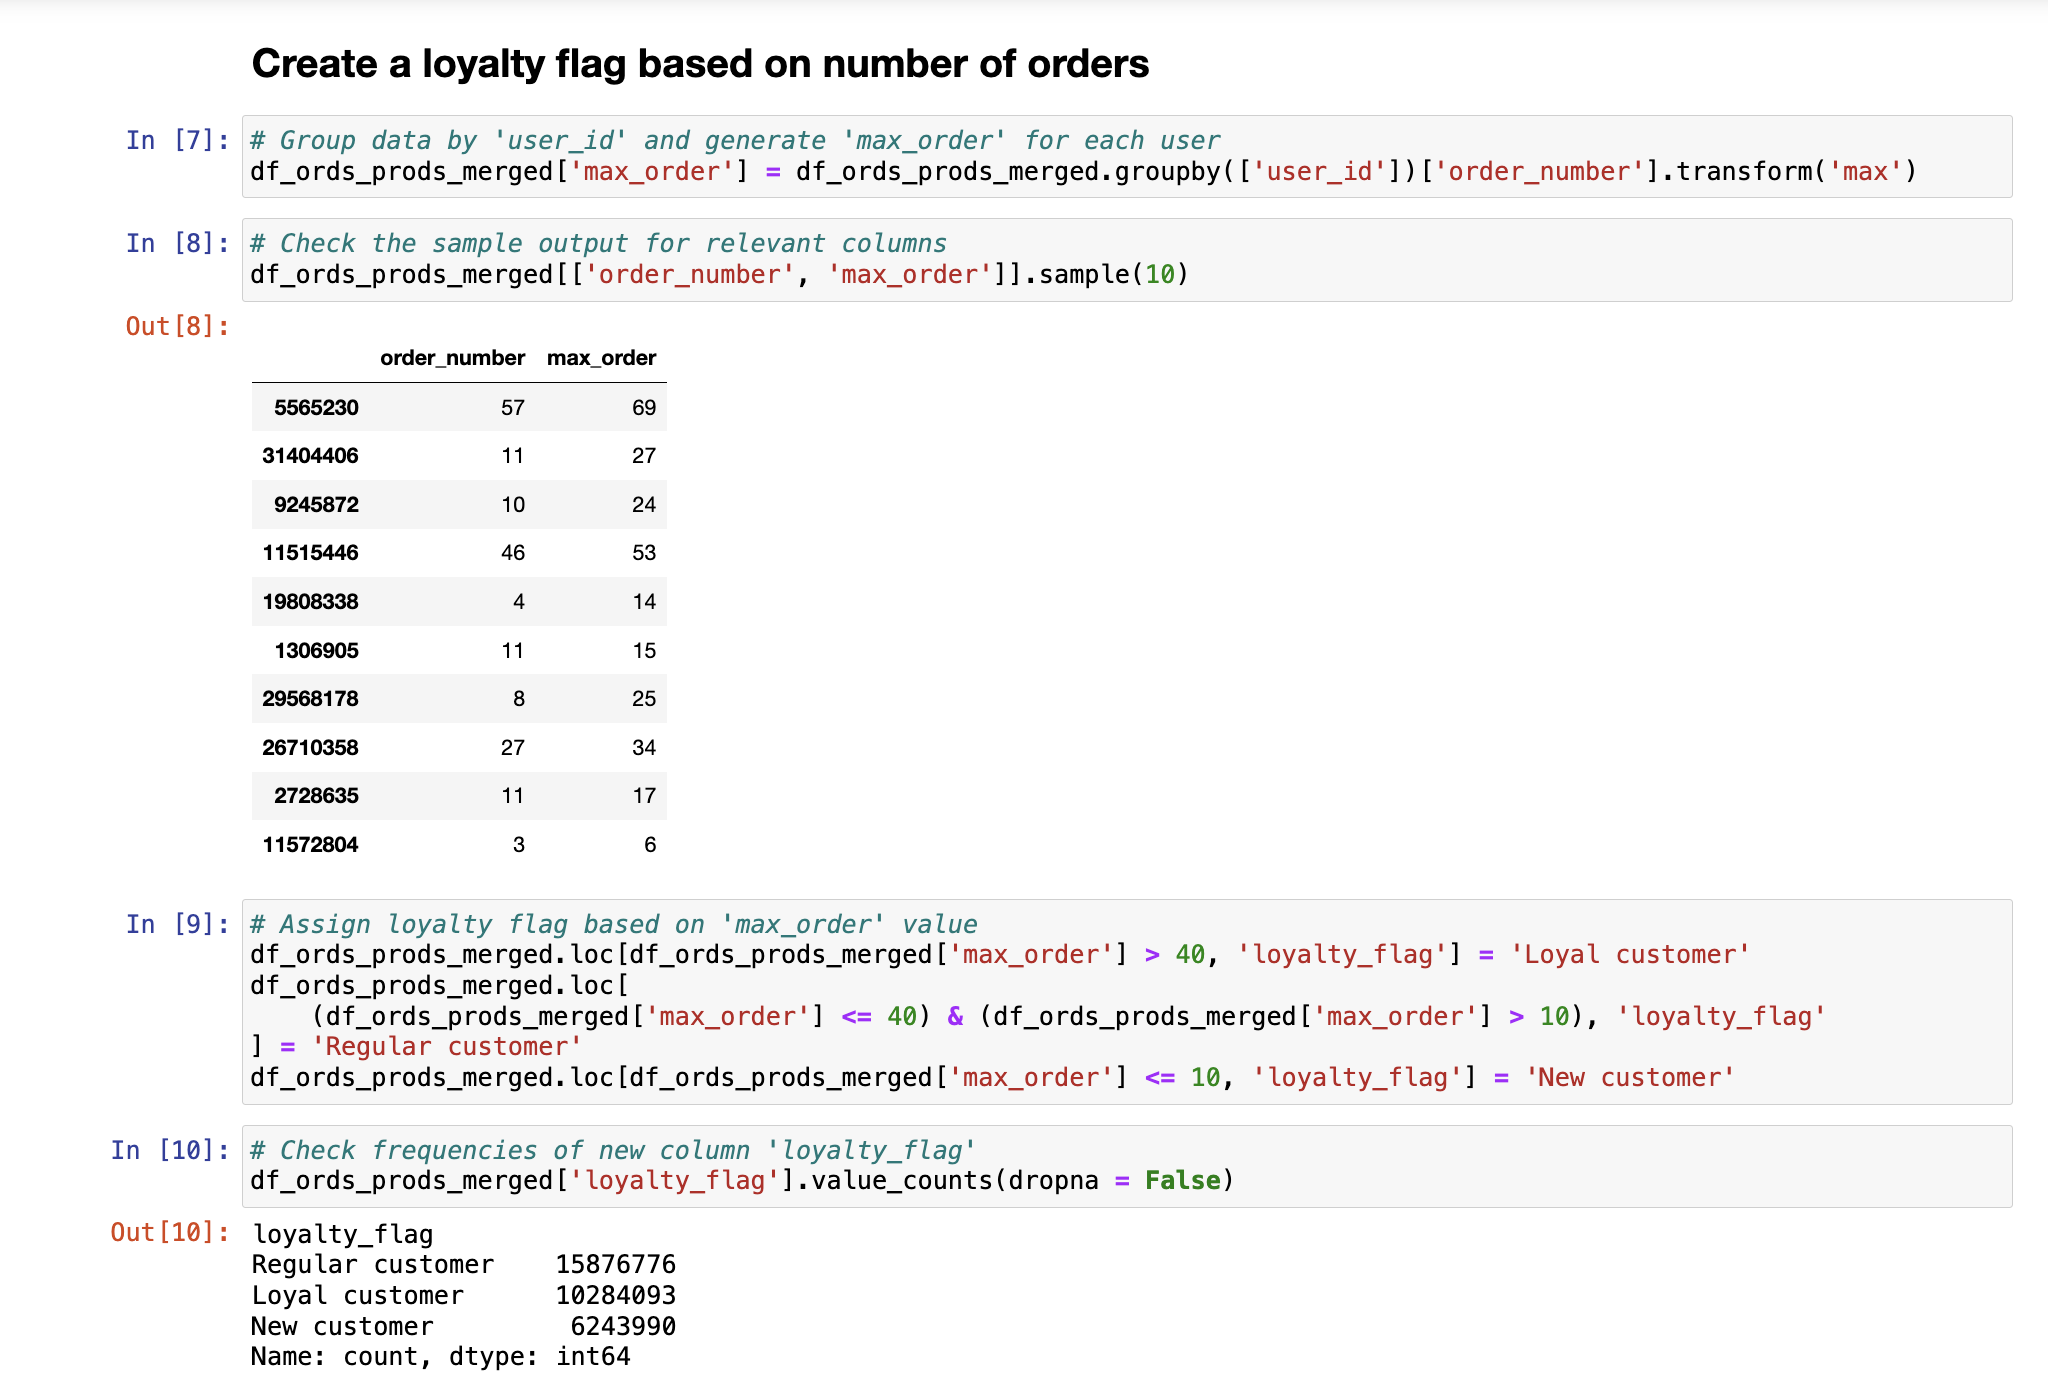
- Flag creation: New columns have been added, such as a loyalty flag for repeat customers.
- Descriptive statistics: The groupby() function was used to create summary columns (e.g. average order size, total spend per customer).
Outcome: Detailed summary statistics and flags that provide a clearer picture of customer behavior and trends.
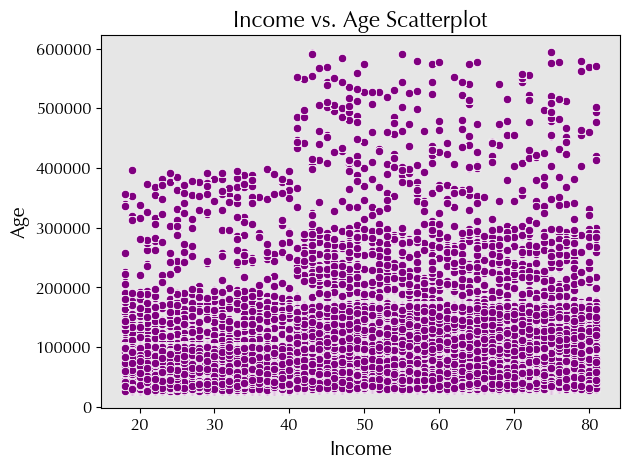
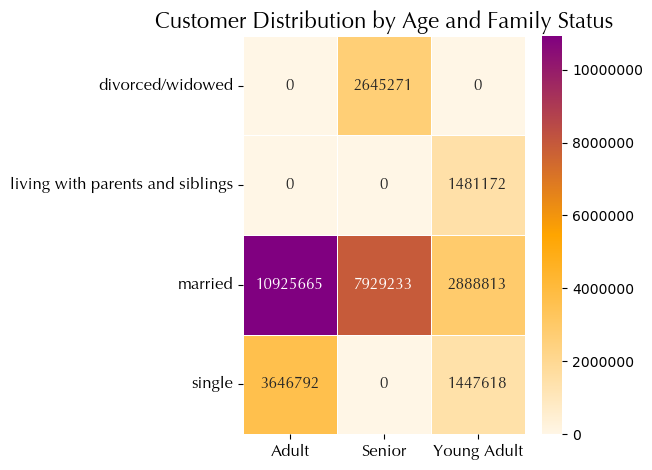
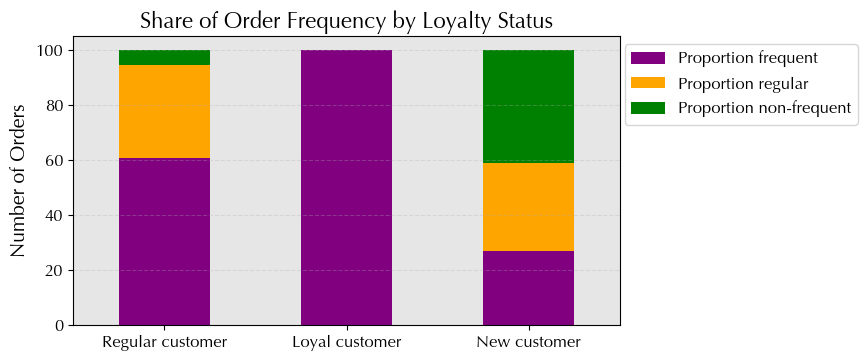
Data Visualization
Objective: Visualize data to discover patterns and relationships.
Process:
- Data preparation: Customer data was imported and merged with the existing dataset.
- Visualization: Various graphs, such as histograms, bar charts, line graphs, and scatterplots, have been created to visualize different variables and their relationships.
Outcome: Visualizations that highlight key patterns and relationships to help interpret data.
Excel Reporting
Objective: Provide a comprehensive report summarizing the analysis and findings.
Process:
- Customer profiling: New columns and flags have been created to profile customers, such as identifying high-frequency buyers.
- Order behavior analysis: The ordering behavior of different customer groups was analyzed to identify trends and preferences.
- Report creation: A detailed report was created summarizing the methodology, analysis, findings and recommendations. This report included insights such as peak shopping times, popular products, and customer retention trends.
Outcome: A well-documented report for Instacart stakeholders that provides actionable insights and recommendations to improve business strategies.
Retrospective
This project successfully cleaned, merged, and analyzed Instacart’s data, providing valuable insights into customer behavior and ordering patterns. Some of the key challenges during the analysis included:
- Dealing with mixed data types in columns required careful standardization for accurate analysis.
- Handling missing values required deciding whether to impute data or remove incomplete records, balancing data retention and integrity.
- Combining multiple data frames required matching key columns correctly and resolving discrepancies to prevent data loss or incorrect joins.
- Developing meaningful new variables with conditional logic required careful planning and validation, especially when defining flags such as customer loyalty.
- Summarizing data with groupby functions required a deep understanding of the dataset and efficient query execution.
- Choosing the right visualizations to accurately represent the data required technical plotting skills and an understanding of the audience and key messages.
- Translating complex analysis into clear, actionable insights for stakeholders required synthesizing large amounts of information into an accessible format.
- Maintaining clean, well-documented, and reproducible code was essential for project understanding and future development, requiring adherence to coding standards and effective commenting.
- The final report needed to balance depth of analysis with clarity and brevity, including enough detail to support findings while remaining concise and focused on key insights.
The final report provided stakeholders with concrete recommendations to improve customer satisfaction and optimize operations, demonstrating the power of in-depth data analysis and visualization.
