Understanding Disaster Risk
A Data-Driven Exploration of the WorldRiskIndex
Motivation
Every year, millions of people around the world are affected by extreme natural events such as earthquakes, storms, and floods. While the intensity of these events is important, the societal framework and response structures are equally critical in determining the magnitude of the disaster.
Objective
The goal of the analysis is to identify and understand the interactions between natural hazards, socio-economic vulnerability, and infrastructure resilience as reflected in the WorldRiskIndex. It also aims to uncover patterns in the interaction of the dimensions that could contribute to data-driven decision-making and support disaster risk management.
Definitions
The WorldRiskIndex (WRI) measures disaster risk from extreme natural events and climate change impacts, calculated for each country by combining exposure and vulnerability.
Exposure assesses the susceptibility of populations to earthquakes, tsunamis, floods, cyclones, droughts, and sea-level rise.
Vulnerability includes susceptibility, coping mechanisms, and adaptation strategies within societies to mitigate damage and prepare for future risks.
Project Scale
6 Weeks | 7 Deliverables
Tools
Python | Jupyter Notebooks | Tableau
Analytical Techniques & Process
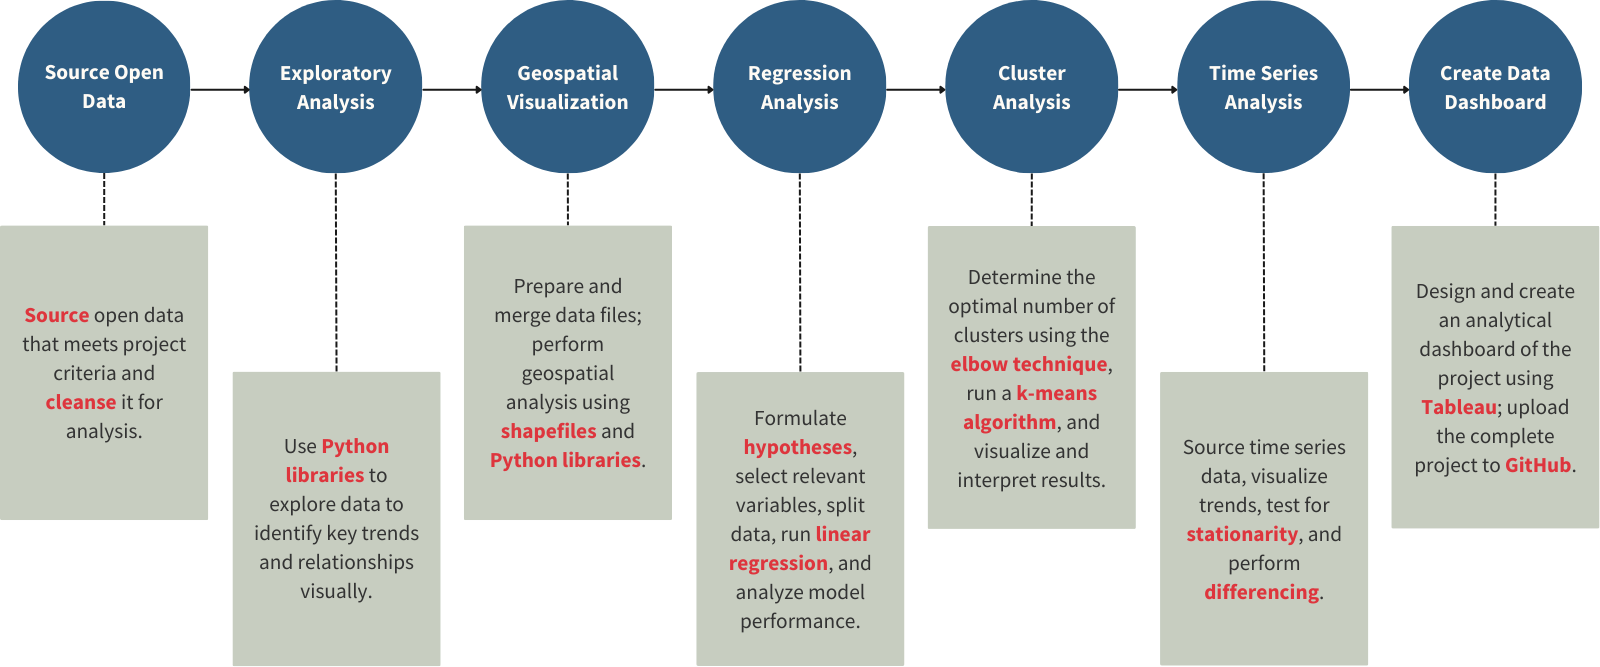
Exploratory Analysis: Relationships
I started by digging into the data using a correlation matrix. The initial analysis was promising – there was a strong correlation between the WorldRiskIndex and exposure, suggesting that exposure plays a key role in overall risk.
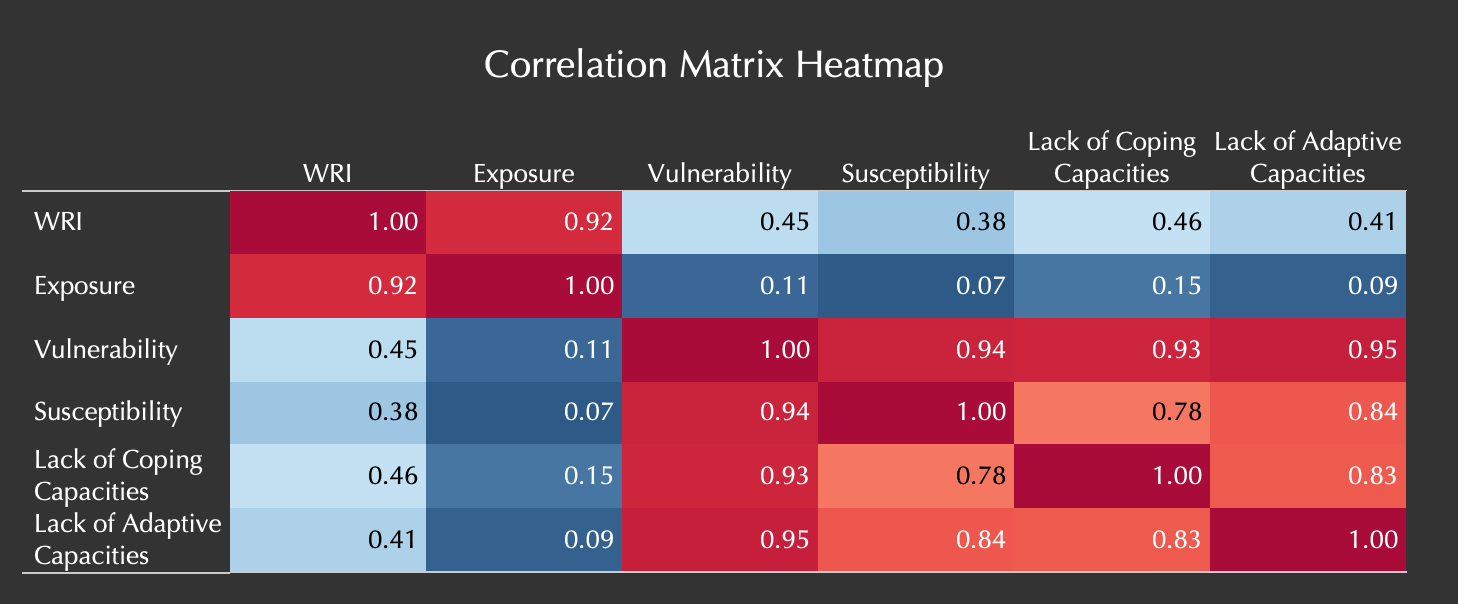
The WRI and vulnerability dimensions also showed a moderate correlation, suggesting a relationship, but not a perfect one.
This led me to delve deeper into the structure of vulnerability by asking: “How vulnerable are countries around the world to natural disasters?”
Exploratory Analysis: Focus Vulnerability
Exposure to natural hazards cannot be prevented directly, but the moderate correlation between vulnerability and the WRI suggests that even highly exposed countries could be at lower risk if they addressed underlying vulnerabilities.
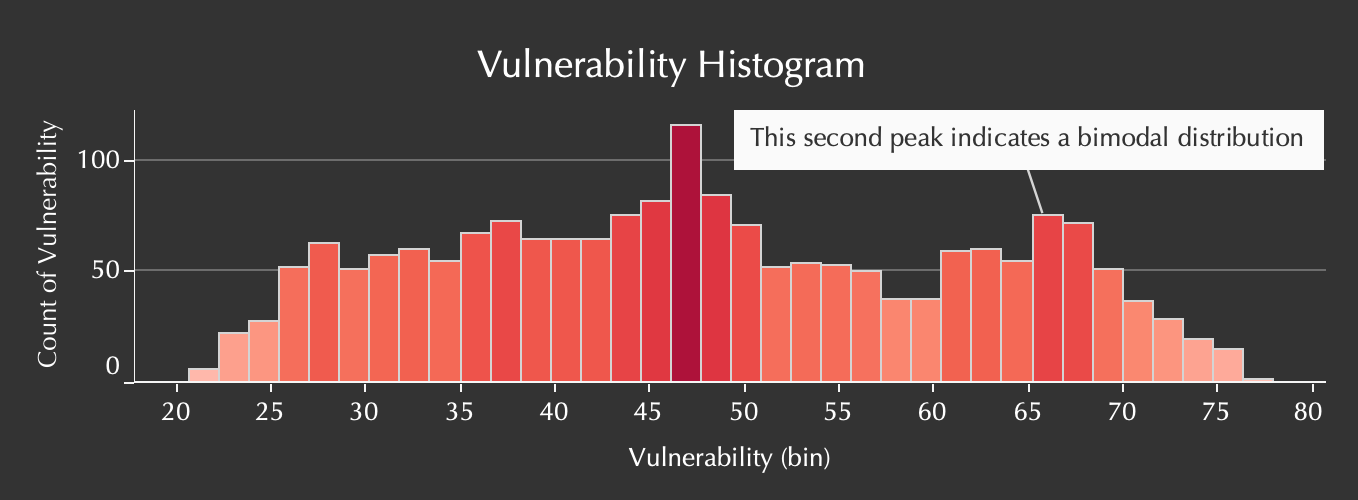
The vulnerability histogram revealed a bimodal distribution – two distinct peaks suggesting separate groups of countries with different levels of vulnerability. Understanding the factors driving these peaks could provide valuable insights into disaster risk management.
Raw numbers can only tell part of the story. To get a clearer picture, I created geospatial visualizations for WRI, exposure, and vulnerability.
Geospatial Visualization: Mapping Risk
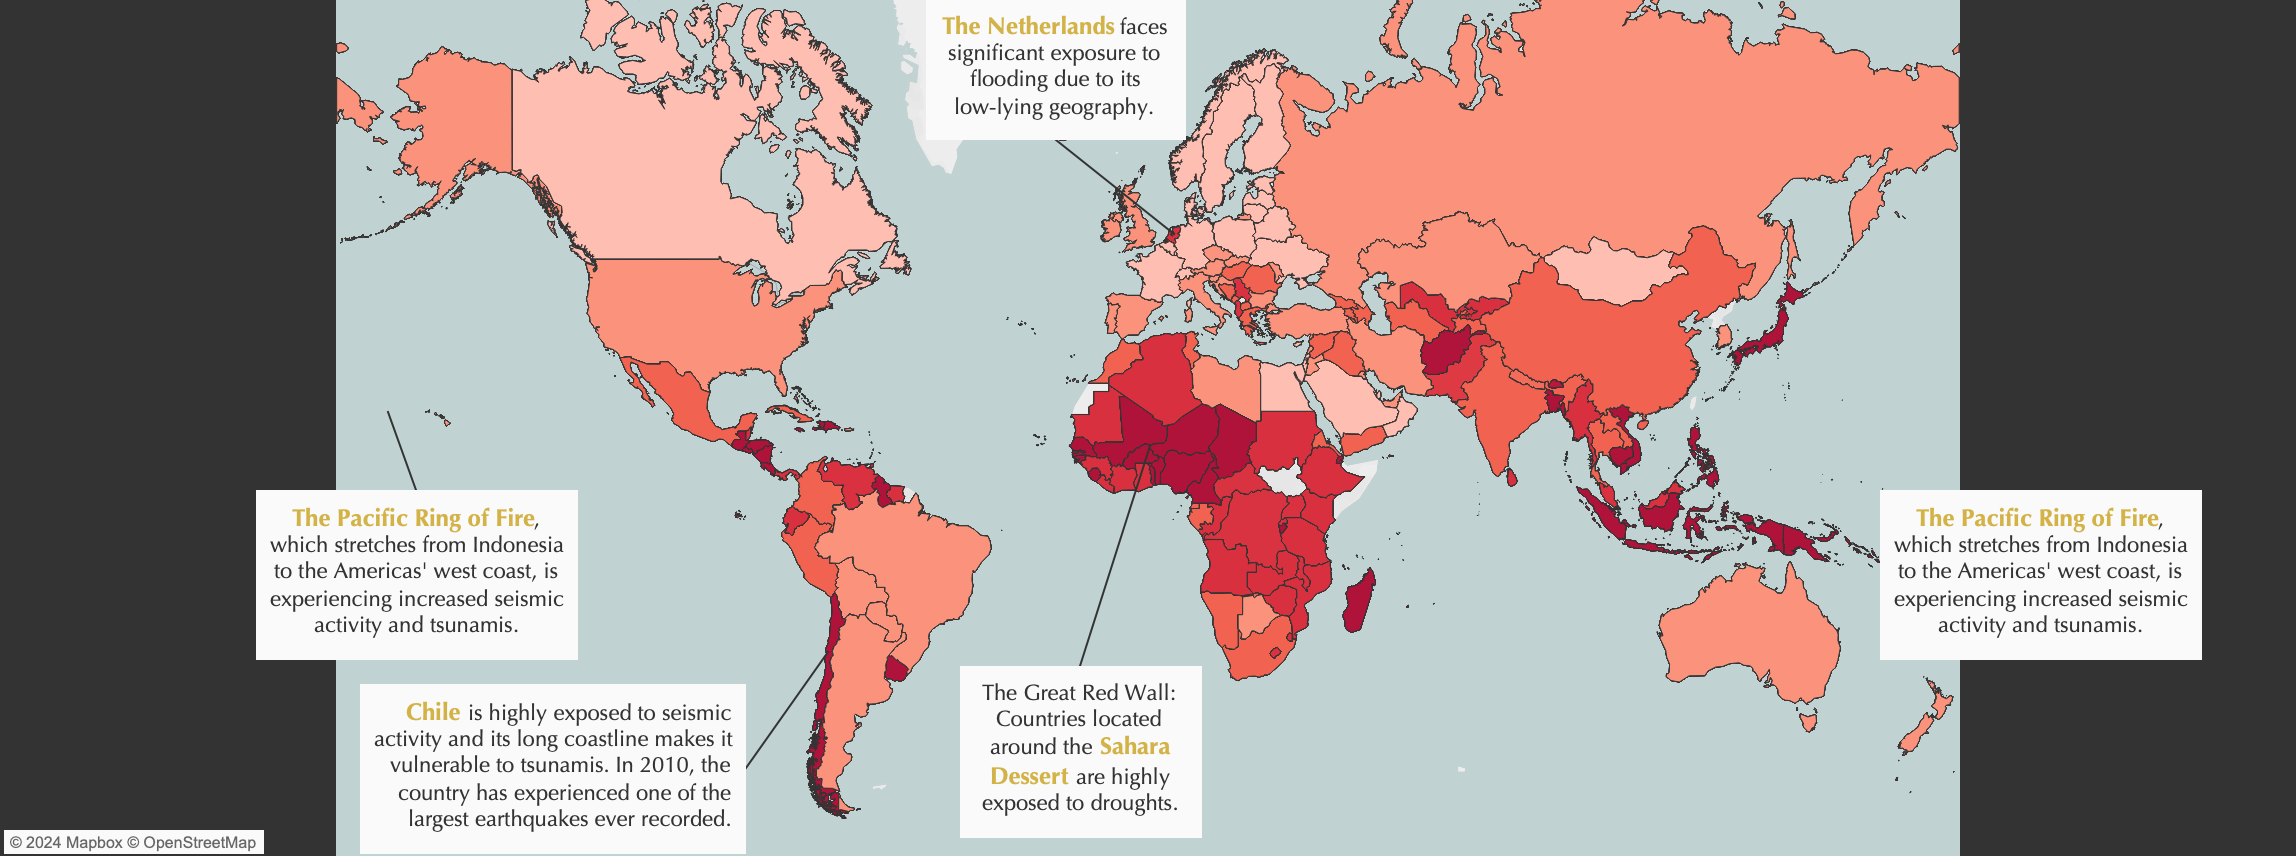
Not surprisingly, tropical regions and areas prone to earthquakes and volcanoes had the highest exposure. Interestingly, countries such as Australia and Peru had high exposure but low overall risk.
This suggested strong disaster preparedness and response capabilities – possibly representing one of the subgroups observed earlier.
Regression Analysis: Beyond Linearity
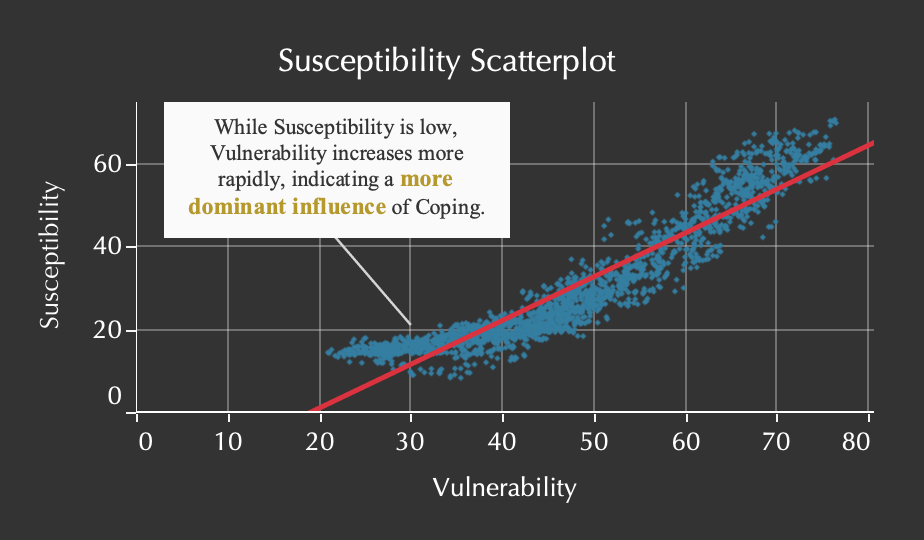
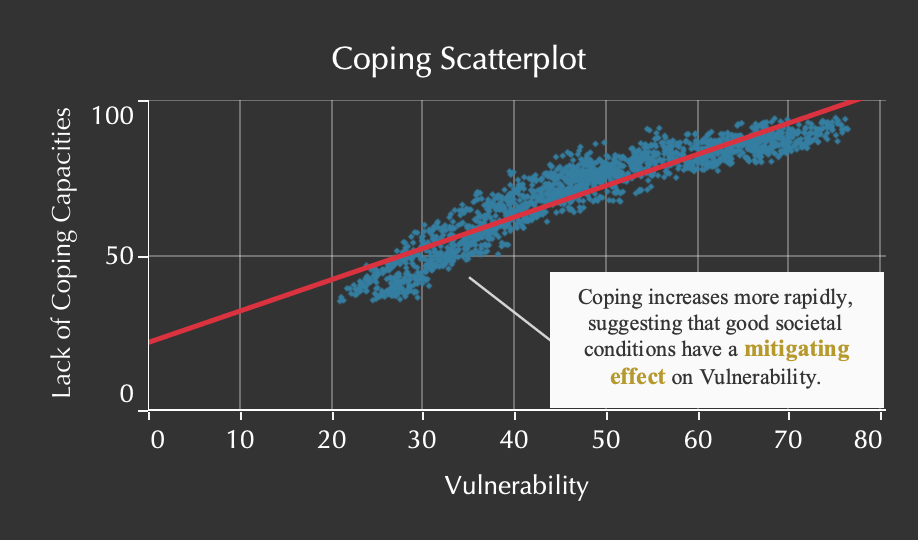
While linear regression proved the hypothesis that exposure significantly impacts the WRI, a closer look at the sub-dimensions of vulnerability – susceptibility and coping – revealed non-linear relationships.
This pointed to “interaction effects,” where the impact of one sub-dimension depends on the other.
Cluster Analysis: Unveiling Risk Profiles
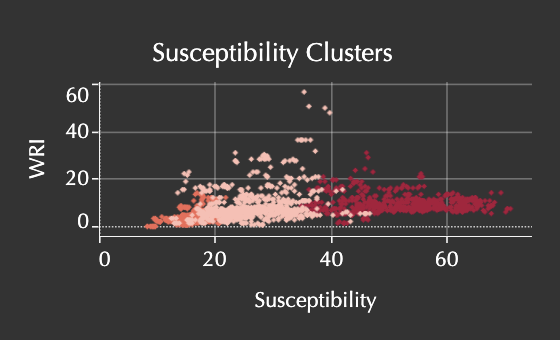
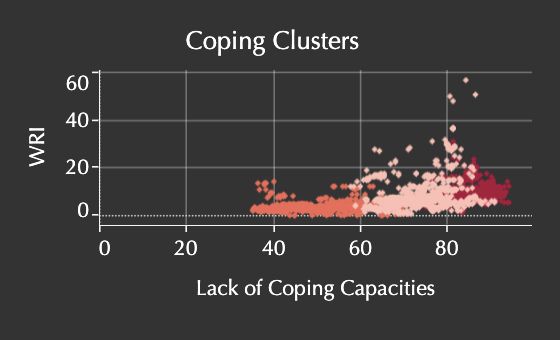
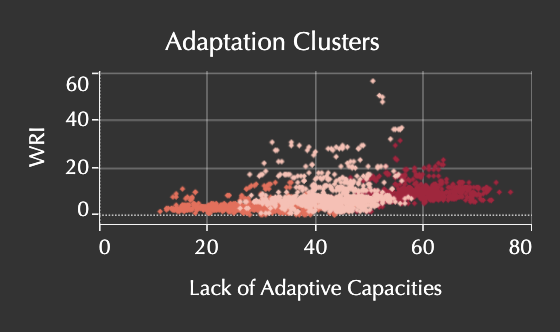
Using cluster analysis to explore risk profiles shaped by bimodal distributions and non-linear dynamics, I was able to identify distinct clusters based on vulnerability, coping, and adaptation.
One cluster in particular stood out: countries with high exposure but low vulnerability. Despite coping and adaptation challenges, these countries exhibit potential resilience factors to natural hazards that warrant deeper investigation.
To understand the geographic distribution of these clusters, I once again turned to spatial visualization.
Cluster Analysis: Mapping Profiles
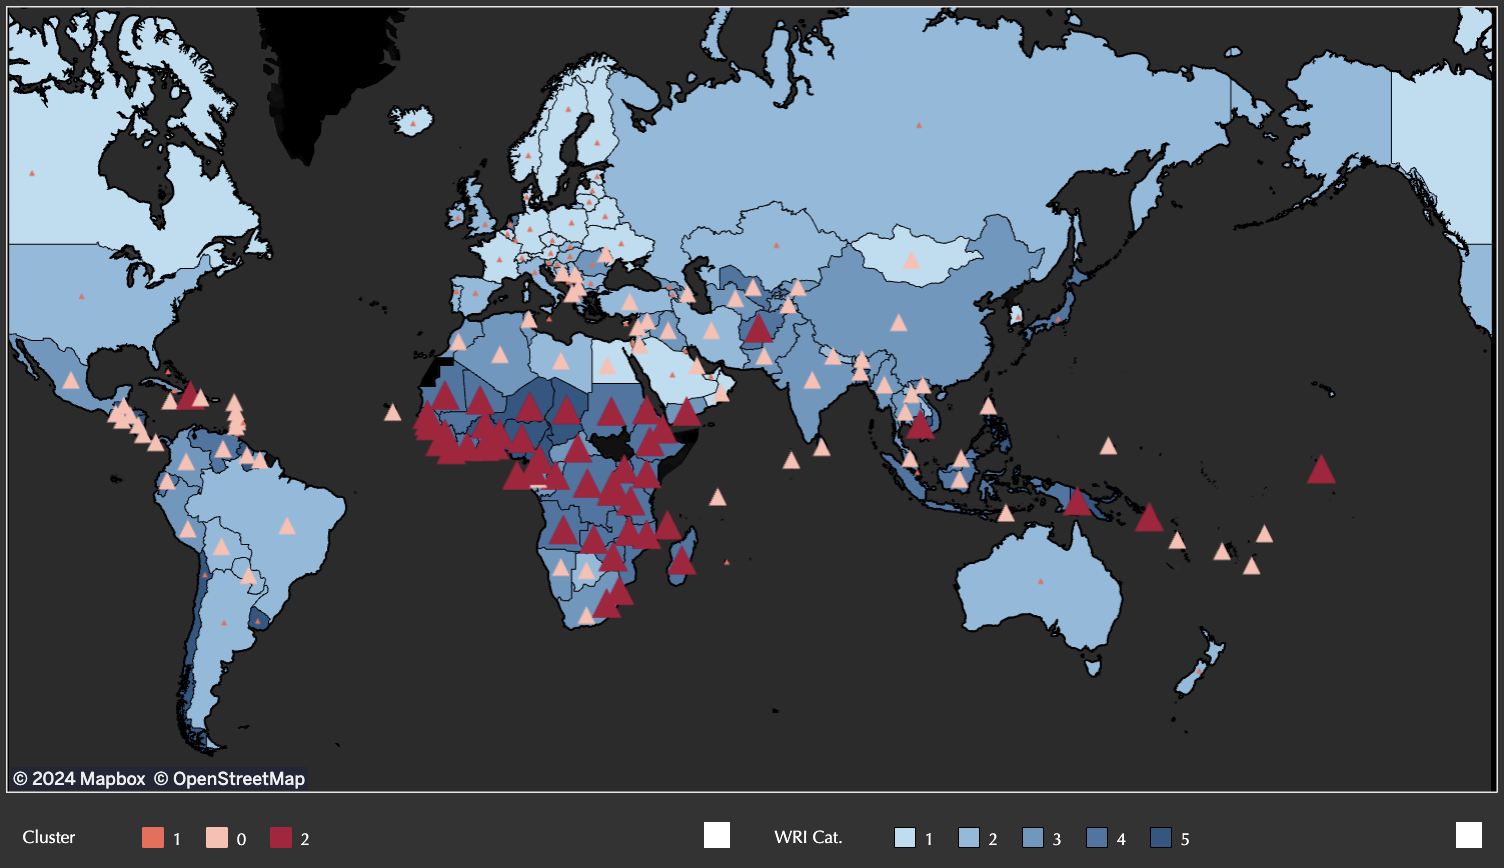
The cluster with high exposure and low susceptibility was most prevalent in Central/South America, North Africa, and Asia.
These regions may share common challenges, such as rapid urbanization, environmental degradation, and limited resources for disaster management, but generally strong societal conditions.
Time Series Analysis: Challenge & Opportunity
Unfortunately, the limited timeframe of the WorldRiskIndex data (annual since 2011) wasn’t suitable for time series analysis. However, recognizing that exposure is a key factor, I instead performed a time series analysis, including stationarity and differencing, on data on global temperature anomalies, a potential indicator of climate-related impacts.
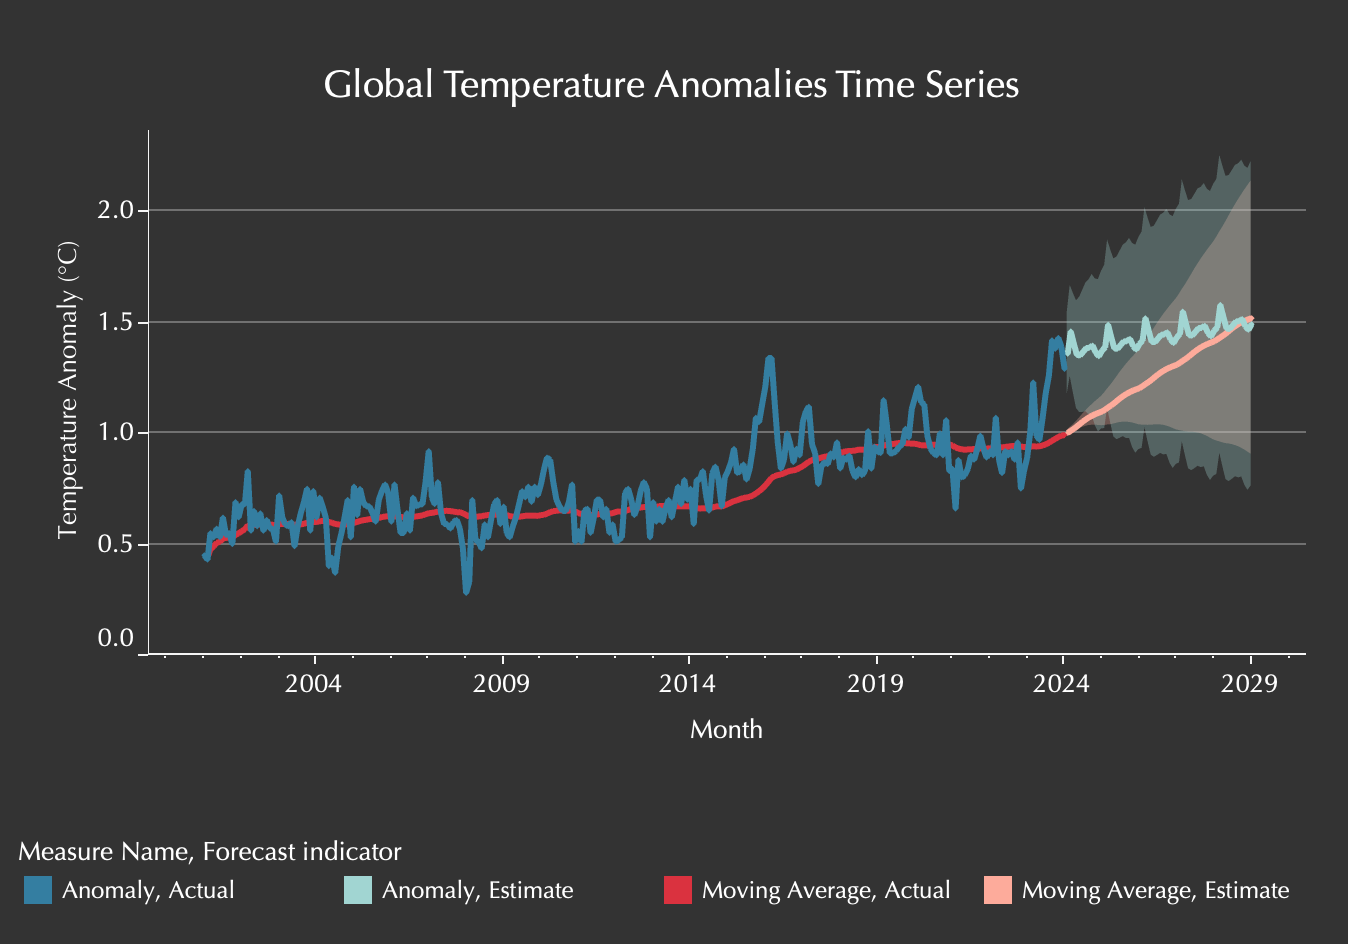
This opened up some interesting possibilities. Future analyses could explore how the vulnerability of different regions to climate-related disasters varies based on their exposure to temperature anomalies and other environmental factors.
Retrospective & Outlook
The analysis successfully achieved its objective by revealing complex relationships among the dimensions of the WorldRiskIndex. It validated the hypothesis that hazard exposure significantly influences a country’s risk profile and identified three distinct vulnerability dynamics that contribute to different levels of risk.
The project highlighted the multifaceted nature of disaster risk and the need for targeted risk reduction strategies. For example, high-risk regions require interventions that address poverty and strengthen disaster response capacities, while medium- to high-risk regions should focus on strengthening infrastructure resilience.
In addition, the spatial analysis suggested a potential link between a country’s exposure, societal vulnerability, and level of development. This opens up exciting opportunities for further research, such as exploring how dimensions of human development influence societal vulnerability. Investigating these relationships could provide a deeper understanding of disaster risk and help develop resilient strategies for future challenges.
